
| Título: | Minimal disease activity (mda) in patients with recent-onset psoriatic arthritis. Predictive model based on machine learning |
|---|---|
| Autores: | R. Queiró Silva, D. Seoane-Mato, A. Laiz, E. Galindez, C. A. Montilla-Morales, H. S. Park, J. A. Pinto Tasende, J. J. Bethencourt Baute, B. Joven-Ibáñez, E. Toniolo, J. Ramirez, A. Serrano García |
| Año: | 2022 |
Objectives. To detect patient and disease variables associated with achieving MDA in patients with recent-onset PsA.
Methods. We performed a multicenter observational prospective study (2-year follow-up, regular annual visits), promoted by the Spanish Society of Rheumatology. Patients aged ≥18 years who fulfilled the CASPAR criteria, with less than 2 years since the onset of symptoms, were included. The intention at the baseline visit was to reflect the patient’s situation before disease progress was modified by the treatments prescribed by the rheumatologist.
All patients gave their informed consent. The study was approved by the Clinical Research Ethics Committee of the Principality of Asturias.
MDA was defined as fulfillment of at least 5 of the following: ≤1 tender joint; ≤1 swollen joint; PASI ≤1 or BSA ≤3%; score on the visual analog scale (VAS) for pain provided by the patient ≤1.5; overall score for disease activity provided by the patient ≤2; HAQ score ≤0.5; ≤1 painful enthesis [1].
The dataset contained data for the independent variables from the baseline visit and from follow-up visit number 1. These were matched with the outcome measures from follow-up visits 1 and 2, respectively. We trained a random forest–type machine learning algorithm to analyze the association between the outcome measure and the variables selected in the bivariate analysis. In order to understand how the model uses the variables to make its predictions, we applied the SHAP technique. This approach assigns a SHAP value to each value of each variable according to the extent to which it affects the prediction of the model (the higher the absolute SHAP value, the greater the influence of this data item on prediction) and to how it affects the prediction (if the SHAP value is positive, the data item positively affects the prediction, that is, it confers a higher value on the prediction). The SHAP summary graphs order the predictors by their importance in the predictions of the model. This importance is calculated with the mean of the SHAP values assigned to each data item of a variable; mean values <0.01 indicate the low importance of the variable in the model. We used a confusion matrix to visualize the performance of the model. This matrix shows the real class of the data items, together with the predicted class, and records the number of hits and misses.
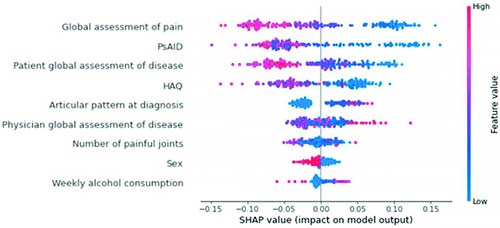 Results. The sample comprised 158 patients. 14.6% were lost to follow-up. 55.5% and 58.3% of the patients had MDA at the first and second follow-up visit, respectively. The importance of the variables in the model according to the mean of the SHAP values is shown in Table 1. The variables with the greatest predictive ability were global pain, impact of the disease (PsAID), patient global assessment of disease and physical function (HAQ-Disability Index). The SHAP values for each value of each variable are shown in Figure 1. The percentage of hits in the confusion matrix was 85.94%.
Si te interesa esta publicación, puedes descargarla:
